The weekly letterA Citis AI data featurePAYNE · OCTOBER 30, 2026PAYNE
REAL ESTATE · CAPITAL · POLICY · THE PENINSULA
PLANNING MEDIAN
165 days297 APPROVED CASES
BUILDING MEDIAN
210 days59 ISSUED PERMITS
MATCHED PATH504 days34 COMPLETED PROJECTS
RESEARCH SNAPSHOTOct 262026 · CITIS AI

THE TIME BEFORE THE BUILD · A CITIS AI DATA FEATURE
How long does it take
to get a permit in Palo Alto?
504days
Median from planning submission to building-permit issuance in Citis AI’s matched sample of 34 completed projects.
Middle half: about 360–755 days. Elapsed time, not city staff time.
Stanford / Peninsula context photograph · PAYNE photograph.

The quiet book · page 7
Crescent Park. Coming to market.
Approximately 12,000 sq. ft. of land.
Private inquiries by email or text.

The closing story · page 8
Pitman finally sells.
Plus the Fed, mortgage rates, AI wealth,
Alphabet, and the economy.
Aerial: prior listing photography supplied by Payne. Pitman: MLSListings / Redfin; Xin Jiang, Compass.
Selected historical completed cases, not a citywide service standard or a prediction for every permit. Planning and building medians use different samples; do not add them. Full methodology on page 15.
Citis AI / DataPalo Alto permitsPAYNE · OCTOBER 30, 2026The cover story
The permit clock
has more than one face.
Planning approval and a building permit answer different questions. Citis AI tracks the milestones separately.
PlanningApplication submitted
→ decision effective
→BetweenDesign / preparation / timing
between applications
→BuildingBuilding application submitted
→ permit issued
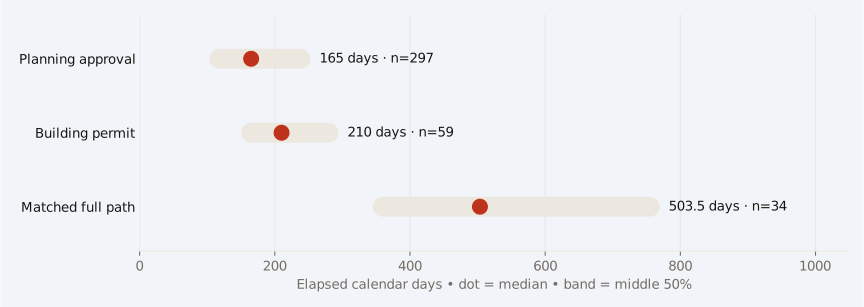
Separate samples: planning n=297; issued building permits n=59; matched full path n=34. Middle-half bands are the 25th–75th percentiles. Exact full-path median: 503.5 days.
The planning sample contains 297 approved new-home Individual Review cases, excluding revisions to previously approved projects. Its median is 165 elapsed calendar days from submission to effective decision. Half the observed durations fall between 118 and 238 days.
The building sample contains 59 issued new-home permits. Submission to issuance has a median of 210 days; the middle half spans approximately 165–280 days. That includes time spent responding and resubmitting, not just city review.
The 34 projects with matched planning and building records provide the end-to-end view: a median of about 504 days, with the middle half at roughly 360–755 days. Construction itself is not included.
These samples do not represent every Palo Alto permit. They focus on selected homebuilding records with usable milestones. The full-path figure also includes the interval between the planning decision and the building application. It should not be described as 504 days of city delay.
The practical point: distinguish design review, building review, and the time between them before choosing a target start date.
Why the first submission matters
10 out of 297.
Only 10 approved new-home planning cases in the sample had no recorded notice of incompleteness. That is 3.4%.
Each document icon represents one approved planning case. Blue: no recorded incomplete notice. Silver: at least one recorded notice. This is not a denial rate.
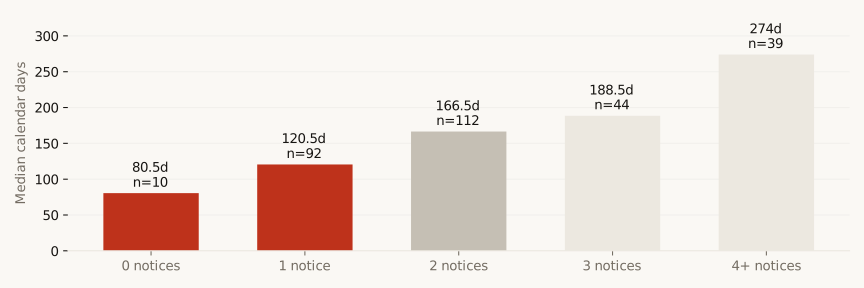
The pattern is clear in the completed records: more incomplete notices are associated with longer elapsed planning timelines. The zero-notice group has a median of 80.5 days; the four-or-more group has a median of 274 days.
That is an association, not proof that the notices alone caused the difference. More complex projects may both require more revisions and take longer.
The building stage has its own iteration pattern. Forty-two of the 59 issued permits—about 71%—have at least four recorded resubmittal rounds. Planning incompleteness notices and building resubmittals are distinct workflow measures.
For an owner, the useful question is what a complete, coordinated submission requires for the actual project—not whether a citywide headline sounds fast or slow.
Citis AI analysis of city workflow records, snapshot October 26, 2026. Completed cases only; source definitions and exclusions on page 15.
Citis AI / ProfessionalsArchitects in the recordPAYNE · OCTOBER 30, 2026A data-based starting point
Who is in the record?
The seven most represented applicant/design-firm names in the reviewed approvals, with their observed planning timelines.
| Applicant / firm | Projects | Median days | New homes* |
|---|
| Kohler Architects | 52 | 116 | 44 |
| March Design | 35 | 161 | 29 |
| LEL Design | 10 | 282.5 | 8 |
| DL Architecture & Planning | 7 | 119 | 3 |
| WEC & Associates | 6 | 125 | 6 |
| Y. Chen Architect | 6 | 168.5 | 5 |
| Studio S Squared Architecture | 6 | 243.5 | 4 |
*New homes are a subset of the project count. This table mixes new homes and other Individual Review projects. Days run from planning submission to decision effective—not building-permit issuance. Sorted by representation in the sample, not design quality.
What stands out
Kohler Architects appears on 52 reviewed projects, the largest count in this table, with a 116-day median. March Design follows with 35 projects and a 161-day median. These are larger observed samples than the other firms shown.
A prospective client can use that history to ask a more informed question: which completed projects are genuinely similar to the one being proposed?
What the table cannot tell you
The analysis does not adjust for project complexity, submission year, client revisions, appeals, or other circumstances. It is not a ranking of the best architects and does not establish that hiring one firm causes a faster approval.
Firm names come from approval-letter applicant information. Historical participation should be checked directly with the firm, along with current availability and the scope of its role.
A better architect interview
Ask for comparable local approvals, the proposed team, the anticipated review path, and who will coordinate responses across architectural, structural, and other disciplines.
Source: Citis AI approval-letter/timeline join, 359 matched approved Individual Review records, revisions excluded. Named-firm coverage is incomplete; seven displayed rows are selected by project count.
Citis AI / The owner’s lensFrom parcel to planPAYNE · OCTOBER 30, 2026Putting the research to work
Read the lot
before the clock starts.
The Citis AI connection: organize parcel facts, project scope, and observed approval history before relying on a construction calendar.
Palo Alto / Stanford context photograph from PAYNE’s existing asset library.
A parcel is not a buildable envelope. Its size is only one input. Zoning, setbacks, site constraints, existing improvements, and the proposed design determine the questions that must be answered before a development plan becomes credible.
The Citis AI research makes another input visible: time. It organizes public permit milestones into comparable stages and shows the spread in completed projects. It also identifies firms associated with prior applications, giving an owner a more concrete starting point for diligence.
The value is better questions, earlier. Which review path applies? Is the comparison set new construction or an addition? Does the plan introduce features that make older examples less comparable? What documentation needs to be ready before submission?
This analysis does not demonstrate that Citis AI shortens approval times. It supplies historical evidence for evaluating assumptions. A project-specific schedule still needs the architect, other consultants, and the city’s current requirements.
For PAYNE readers
A Crescent Park property.
Nearly 12,000 square feet of land.
Coming to market. If this is the kind of opportunity you have been waiting for, reach out privately.

Prior listing aerial photograph supplied by Payne. Existing home shown; photography is historical and may not reflect current presentation.
The opportunity
A Crescent Park property on approximately 12,000 square feet of land will be coming to market. There is an existing home on the site; this is not being presented as a vacant lot.
For anyone considering a purchase, a longer-term home, or future improvements, the setting and site deserve a closer look. Any redevelopment potential would need property-specific review.
Start a private conversation
If you are interested, send me a private email or text message. I can share the details and discuss your timing and what you are looking for.
Please mention “Crescent Park” so I can connect your inquiry with this property.
Approximately 11,760 sq. ft. per the current owner-confirmed property file; rounded for this feature. Buyer to verify. No asking price or specific launch date is announced here.
Real estateThe property of the weekPAYNE · OCTOBER 30, 2026The house returns.
This time, with a closing.
A park-facing residence previously featured in PAYNE has sold. Its setting and finished design tell the story behind the address.
Photographs via MLSListings / Redfin · Listing: Xin Jiang, Compass · DRE #01961451.
The appeal begins at the edge of the property. Eleanor Pardee Park gives this home an outlook that cannot be recreated simply by upgrading a kitchen or adding square footage. The setting is part of the product.
The listing describes a custom French Modern residence completed in 2024. Its plan combines formal entertaining spaces with a great room, terraces, and outdoor living areas. The result asks buyers to value the whole experience of the property, rather than a floor-area calculation alone.
That is the useful lesson for nearby owners. A closing can establish a reference point, but the comparison still requires work. Condition, site, layout, and the practical appeal of a finished home determine how far that reference travels.
Useful comparisons require the same neighborhood definition, property category, time period, and square-footage basis. A distinctive home deserves a closer look than a single headline number.
A closer look
Beyond the headline number.
The setting, the finish, and the spaces between rooms are part of the valuation story.

1418 Pitman Avenue · Listing photography. Photographs via MLSListings / Redfin · Listing: Xin Jiang, Compass · DRE #01961451.
For sellers
Presentation helps buyers understand what is distinctive. It works best when the photographs, condition, and pricing tell a consistent story.
For buyers
Use the photos to form questions, then verify the answers through a visit, disclosures, and a comparison with relevant closed sales.
October 28 · The decision
A pause with dissent.
The benchmark stayed where it was. Two votes remind us that a hold is not a promise of a cut.
TARGET RANGE3.75–4%FEDERAL FUNDS
IN FAVOR10HOLD
DISSENTING2PREFERRED +0.25 POINT
DECISION DATEOct 282026
The Federal Reserve kept the federal funds target range at 3.75% to 4%. Lisa Cook and Beth Hammack dissented because they preferred a quarter-point increase. The committee described economic activity as expanding strongly while inflation remained elevated.
The decision leaves a practical question for borrowers: what can be planned around, and what remains uncertain? The current policy range is a fact. The next move is not. Financing decisions that require a future cut to become comfortable remain exposed to a forecast.
There is also an important distinction between the rate the Fed controls and the rate on a home loan. A mortgage packages a longer stream of payments and a different set of risks. Bond investors, lenders, and borrowers all help determine its price.
For sellers, the policy story matters through the buyer’s budget. Some households are highly sensitive to monthly financing costs; others are using substantial cash or proceeds from another sale. A single headline does not describe both groups equally.
For buyers, the useful response is preparation. Compare actual terms, including points and fees, and understand what changes if a closing is delayed. A preapproval is more useful than a prediction about the next meeting.
Our reading is restrained: this was a pause with disagreement about the need for tighter policy. It provides no guarantee of the direction or timing of the next rate change.
A rate forecast is not a financing commitment.
RatesThe financing deskPAYNE · OCTOBER 30, 2026Mortgages · October 29
The payment,
not just the rate.
A modest weekly decline is welcome. Put it beside the loan balance and the actual costs of closing.
This week
7.24%
National 30-year fixed average
Last week
7.32%
A decline of 8 basis points
Freddie Mac’s national 30-year fixed average eased to 7.24%, according to Thursday’s AP report. That is a useful measure of the broad market, but it is not an individual borrower’s quote or a guarantee of jumbo-loan pricing.
Small changes become easier to interpret in dollars. On a hypothetical $1 million, fully amortizing, 30-year fixed loan, 7.32% produces about $6,870 in monthly principal and interest. At 7.24%, the payment is about $6,815—a difference of roughly $55.
This illustration excludes taxes, insurance, fees, and any mortgage insurance. It holds the loan amount and term constant. It shows the effect of the rate change alone, not whether either rate is available to a particular borrower.
The exercise also shows why the purchase decision needs more than a rate headline. Price, down payment, reserves, and ownership costs can move the household budget by more than a small weekly change in financing.
For someone comparing lenders, the next step is a consistent set of assumptions: the same loan amount, lock period, points, and loan type. Compare the cost of obtaining the rate as well as the rate itself.
For someone comparing homes, run the same financing assumptions across the shortlist. A property that needs substantial near-term work can require more cash than the payment calculation suggests.
Illustration · $1 million loan
About $6,870 / month
At 7.32% · Principal & interest
About $6,815 / month
At 7.24% · Principal & interest
Source: AP / Freddie Mac, October 29. Payment illustrations calculated by PAYNE using standard amortization; rounded to the nearest $5. Not a loan offer.
Technology & capitalAnthropicPAYNE · OCTOBER 30, 2026The prospective liquidity event
When equity becomes cash.
The housing story starts with a filing. It develops through timing, taxes, lockups, and individual decisions.
Stanford and the Peninsula landscape · Context photograph · PAYNE.
Anthropic’s IPO filing brings another potential source of purchasing power into the Bay Area conversation. KQED reported this week on what an offering could mean locally, while highlighting economists’ doubts that the benefits would spread evenly.
The distinction between paper value and available cash is central. A company valuation does not tell us how much employees can immediately spend. Lockup terms, tax obligations, ownership amounts, and personal priorities affect the path from shares to a down payment.
The geographic question is just as important. A company’s success does not create identical demand in every town. Where employees work, existing ties, schools, commuting preferences, and housing availability can concentrate the effect.
For Peninsula owners, the story is worth following without treating it as an automatic repricing of their home. Stronger evidence would be a change in the actual buyer pool: more qualified interest, completed transactions, and comparable homes attracting competition.
Earnings · October 28
The bill comes due.
AI creates opportunities. Public markets still ask how much the buildout costs—and when it earns its return.
For a household paid partly in shares, earnings season can also be part of the homebuying calendar.
Alphabet’s results renewed scrutiny of AI spending and its financial payoff. Reuters reported disappointing search performance and pressure on cash flow as the company continued building AI capacity.
For a Peninsula market letter, the connection is the household balance sheet. A technology employee may receive salary, bonuses, and equity, but those resources behave differently. Cash already in a bank account is not the same as shares that have not vested or stock that has not been sold.
A volatile earnings week can therefore change a family’s comfort level even before it changes income. It may alter the amount someone wants to commit, the reserve they keep, or the timing of a move. Those are possible channels, not evidence that this particular report has already moved home prices.
The same discipline applies on the seller’s side. A buyer’s profession or employer is not a substitute for understanding the actual financing and available funds behind an offer. The terms that can close matter more than the story attached to the company name.
This is also why the IPO story and the earnings story belong in the same issue. One emphasizes the possibility of new liquidity; the other emphasizes uncertainty in wealth already linked to public markets. Both can affect housing decisions, but neither determines them alone.
Our local watch remains transaction-based. If portfolio changes matter to housing, the evidence should eventually appear in budgets, offers, timing, and completed sales—not merely in a dramatic day for a stock.
Third-quarter GDP · Advance estimate
Growth is still here.
The initial reading rose to 3.4% annualized. The composition matters as much as the headline.
The Bureau of Economic Analysis reported real GDP growth of 3.4% at an annualized rate in the third quarter, compared with 2.2% in the second. Investment, consumer spending, and government spending contributed to the increase; declining exports partly offset those gains.
A related measure of private domestic demand—consumer spending plus private fixed investment—grew at a 4.9% annualized pace. The figures are initial estimates and will be revised as more information arrives.
Annualized is an important word. It describes the pace implied if a quarter’s growth continued for a year; it does not mean the economy grew 3.4% in three months. The BEA puts the actual quarter-to-quarter increase at 0.8%.
For housing, aggregate growth provides context rather than a neighborhood appraisal. Economic activity can support incomes and business confidence while individual buyers still face high financing costs. A strong national reading does not eliminate local affordability constraints.
The practical response is to keep the scales separate. Use national data to understand the broader environment. Use local closed sales, property condition, and real financing terms to assess a specific purchase or sale.
Read beside this week’s other stories, GDP reinforces the need for a measured view. There is activity and investment in the economy, but the path from growth to a particular home’s value is neither immediate nor uniform.
National growth supplies the context. Local transactions supply the comparison.
Source: BEA, October 29, 2026. Inflation-adjusted growth rates; third-quarter figures are advance estimates.
The sourcebookData, methods & contactPAYNE · OCTOBER 30, 2026The record behind the letter
The sourcebook.
Citis AI permit snapshot: October 26. News reporting through October 29, 2026.
Permit methodology
Citis AI analyzed public Accela records. The planning crawl targeted 2019–2026; linked older records are also present. The 297-case new-home Individual Review sample has submission dates from August 2018 to June 2026. Approved cases with dated decisions are included; revisions are excluded.
Building: 59 selected issued new-home permits, submitted December 2022–February 2025. Full path: 34 unique matched projects, planning submissions March 2021–June 2024. Those dates describe these samples, not all city activity.
All durations are elapsed calendar days, including applicant response time. Full-path duration includes time between the planning decision and building application, but excludes construction. Separate sample medians must not be added.
Completed-case selection omits unfinished outcomes and may make recent cohorts look artificially fast. This issue does not infer a 2026 speedup or an approval probability. Missing milestones and firm identification limit coverage.
Architects: 359 approved Individual Review records joined to approval letters. Table includes new homes and other IR projects, with no adjustment for project mix. It measures representation and observed time, not professional quality or causality.
Calculations recomputed from the local source CSVs. Displayed 504 days rounds the 503.5-day median. Middle-half bounds are rounded only in prose.